.

.
Hand in Hand Around the World

Thursday, December 14, 2017

The World's Deserts


A desert is a barren area of land where little precipitation occurs and consequently living conditions are hostile for plant and animal life. About one third of the land surface of the world is arid or semi-arid. This includes much of the polar regions where little precipitation occurs and which are sometimes called polar deserts or "cold deserts". The deserts found on Earth are extremely diverse, each unique in their own way. The dunes of the Saharan Desert, the icy tundra of Antarctica, and the Pacific coastline of the Atacama Desert are all deserts. 
There are four different types of deserts based upon their geographic situation:
1.  Polar deserts (Ex: Arctic & Antarctic)

2. Subtropical deserts (Ex: Sahara, Kalahari, Arabian, Great Victoria etc.)

3. Cold winter deserts (Ex: Great Basin, Gobi etc.)

4. Cool coastal deserts (Ex: Namib, Atacama)


The largest deserts in the world are polar deserts. The Antarctic Polar Desert is the largest and covers the continent of Antarctica and has a size of about 5.5 million square miles. The second-largest desert is the Arctic Polar Desert. It has a surface area of about 5.4 million square miles. 

Sahara is the third largest desert overall, and the largest “hot desert” in the world. This desert comprises most of the land in North Africa. The Arabian Desert is situated on the Arabian peninsula, and makes up parts of Iraq, Jordan, Kuwait, Oman, Qatar, Saudi Arabia, the United Arab Emirates, and Yemen. Both the Sahara and Arabian Deserts are known for their sand and sand dunes. The center of Arabian Desert, Rub ’al-Khali, the “Empty Quarter”, forms the largest continuous body of sand in the world.

The Gobi is termed as a “rain shadow desert”, as it is in the lee-ward side of the Himalaya ranges which block the rain (“rain shadow”), keeping clouds from the Indian Ocean from reaching Gobi. Most of the Gobi’s surface is not sandy, but rather exposed, bare rock. It is a cold desert and snow occasionally will accumulate on its dunes. Kalahari is a vast, semi-arid savanna in southern Africa.  It happens to get significantly more rainfall and support more diverse life than its counterparts.


 List of Deserts their types and Location (Country, Continent)

Name
Type of Desert
Location
Antarctic
Polar
Antarctica
Arctic
Polar
Alaska, Canada, Greenland, Iceland, Norway,
Sweden, Finland, Russia
Sahara
Subtropical
Northern Africa
Arabian
Subtropical
Arabian Peninsula
Gobi
Cold Winter
China and Mongolia
Patagonian
Cold Winter
Argentina
Great Victoria
Subtropical
Australia
Kalahari
Subtropical
South Africa, Botswana, Namibia
Great Basin
Cold Winter
United States
Syrian
Subtropical
Syria, Iraq, Jordan, Saudi Arabia
Chihuahuan
Subtropical
Mexico
Great Sandy
Subtropical
Australia
Kara-Kum
Cold Winter
Uzbekistan, Turkmenistan
Colorado Plateau
Cold Winter
United States
Gibson
Subtropical
Australia
Sonoran
Subtropical
United States, Mexico
Kyzyl-Kum
Cold Winter
Uzbekistan, Turkmenistan, Kazakhstan
Taklamakan
Cold Winter
China
Iranian
Cold Winter
Iran
Thar
Subtropical
India, Pakistan
Simpson
Subtropical
Australia
Mojave
Subtropical
United States
Atacama
Cool Coastal
Chile
Namib
Cool Coastal
Angola, Namibia, South Africa
Source: G K Planet

Wednesday, December 13, 2017

Global Food Wastage


Roughly one third of the food produced in the world for human consumption every year — approximately 1.3 billion tonnes — gets lost or wasted. Food losses and waste amounts to roughly US$ 680 billion in industrialized countries and US$ 310 billion in developing countries.That’s important for at least two reasons. The less the world wastes, the easier it will be to meet the food needs of the global population in coming years. Second, cutting back on waste could go a long way to reducing greenhouse gas emissions.

Food waste is a glaring measure of inequality. In poor countries, most of the food waste is on the farm or on its way to market. In South Asia, for instance, half of all the cauliflower that’s grown is lost because there’s not enough refrigeration, according to the United Nations Food and Agriculture Organization. Tomatoes get squished if they are packed into big sacks. In Southeast Asia, lettuce spoils on the way from farms to city supermarkets. Very little food in poor countries is thrown out by consumers. It’s too precious.

But in wealthy countries, especially in the United States and Canada, around 40% of wasted food is thrown out by consumers.  The United States as a whole wastes more than $160 billion in food a year. Food waste and loss has a huge carbon footprint: 3.3 billion tons of carbon equivalent. And that’s not all, according to a 2014 report from the F.A.O. Wasting that much means a lot of water is wasted, too — the equivalent of three times the size of Lake Geneva, as the report puts it.

Some of the most basic fixes are at the bottom end of the supply chain: Metal grain silos have helped against fungus ruining grain stocks in countries in Africa. In India, the F.A.O. is encouraging farmers to collect tomatoes in plastic crates instead of big sacks; they squish and rot less. Higher up the food chain, supermarkets are trying to make a dent by changing the way best-before labels are used — making them specific to various food categories to discourage consumers from throwing out food that is safe to eat — or trying to sell misshapen fruits and vegetables rather than discarding them. 


Some countries are trying to regulate food waste. France requires retailers to donate food that is at risk of being thrown out but is still safe to eat. European Union lawmakers are pushing for binding targets to curb food waste by 50% by 2030. Cutting waste would have “at least the same impact or more than changing diets.” Source: The New York Times
  

Tuesday, December 12, 2017

The Global Village


If we could shrink the Earth's population of 7+ billion to a village of precisely 100 people, with all existing human ratios remaining the same, it would look like this:

Half of the villagers would be female, the other half would be male. 26 would be under 14 years old. 8 are 65 years and over. The village would consist of 61 people from Asia, of whom 19 would be from China, and almost 18 would be Indians, there are 15 people from Africa, 10 guys from Europe, not quite 9 would be from South America and the Caribbean, and 5 from North America. 25 would live in substandard housing or have no home at all. 40 would lack access to basic sanitation and 13 would lack access to safe drinking water. 10 would have no job. Villagers with a job would work in agriculture: 36, industry: 21, and services: 43. 10 would live in least developed countries. 3 would be migrants, internally displaced persons, and refugees.


7 would be unable to read and write (age 15 and over). 7 would have a college education. Their native language would be: 12 are speaking Mandarin Chinese, 5 would speak Spanish, 5 would speak English, 5 would speak Hindi or Bengali, 3 would speak Arabic, more than 2 speak Portuguese, 2 speak Russian, 2 speak Japanese, and 1 speaks German, the rest of the villagers can choose one or the other of the 6000 languages spoken on the planet.


82 would be from less developed countries with an average income of US$ 5,440 in a year, this is the equivalent disposable income of just $15 a day, but 51 of those would live on less than $2 a day. 18 would be from developed countries with an average income of US$ 32,470 in a year, the equivalent disposable income of $90 a day. 22 would be overweight.
The richest 1 in our village actually owns 40% of the entire wealth.


51 of our village people live in areas termed “urban”. The number of people living in urban areas has surpassed the population of rural areas approximately in the year 2005. 60 would live within 100 km (62 miles) of a coastline. About 50 would rely in some manner on coastal and marine habitats for food, building sites, transportation, recreation, and waste disposal.

Half of the villagers would distrust their government.  The village's population would use 77 mobile phones, but they are unequally distributed, some of the villagers would have 2 or more cell phones, other none. 33 would be Internet users, 15 would have Internet access from home and 12 would be active users of Facebook. At least 5 would be part of the gay community  Source: Nations Online


Monday, December 11, 2017

Global Arms Trade


Global arms sales increased for the first time in five years in 2016 as rising geopolitical tensions fueled defense spending. Sales by the world's 100 biggest arms producers increased 1.9% from the previous year to reach $374.8 billion, according to the Stockholm International Peace Research Institute (SIPRI).

Arms sales’ are defined by SIPRI as sales of military goods and services to military customers, including sales for domestic procurement and sales for export. Changes are calculated in real terms and country comparisons are only for the same companies over different years.


American firms remained at the top of the industry in 2016, with sales increasing by 4% to more than $217 billion. That was 58% of the global total.  Sales by Arms sales by companies in Western Europe remain stable, but trends diverge. Russian firms increased 3.8% to $26.6 billion, a slower expansion than in recent years. 

Emerging producers’ category covers companies based in Brazil, India, South Korea and Turkey. The trend in this category for 2016 is dominated by the 20.6% overall increase in the arms sales of South Korean companies, with total sales amounting to 8.4 billion.  

Other established producers’ category covers companies based in Australia, Israel, Japan, Poland, Singapore and Ukraine. The combined arms sales of companies in these countries fell by 1.2% in 2016, largely driven by an overall decrease in the arms sales of Japanese companies (–6.4 per cent). Japan’s largest arms companies experienced sharp falls in 2016.


Sunday, December 10, 2017

Safe Cities Index 2017


The Economist Intelligence Unit released its 2017 Safe Cities Index, ranking 60 cities across 49 indicators spanning digital, infrastructural, health, and personal security concerns. In many respects it’s the very success of cities, in their role as global social and economic hubs, that makes them more vulnerable.


As in 2015, Tokyo tops the overall ranking. The Japanese capital’s strongest performance is in the digital security category while it has risen seven places in the health security category since 2015. However, in infrastructure security, it has fallen out of the top ten, to 12th.


In many cities, security is falling rather than rising: With two exceptions (Madrid, which is up 13 places and Seoul, up six), cities tend to have fallen in the index since 2015 (for example, New York is down 11 places, Lima is down 13, Johannesburg is down nine, Ho Chi Minh City is down ten and Jakarta is down 13)


Asian and European cities remain at the top of the index: Of the cities in the top ten positions in the overall index, four are East Asian cities (Tokyo, Singapore, Osaka and Hong Kong), while three (Amsterdam, Stockholm and Zurich) are European.


Asia and the Middle East and Africa dominate the bottom of the index: Dhaka, Yangon and Karachi are at the bottom of the list. Of the ten cities at the bottom of the overall index, three are in South-east Asia (Manila, Ho Chi Minh City and Jakarta), two are in South Asia (Dhaka and Karachi) and two are in the Middle East and Africa (Cairo and Tehran).


Security remains closely linked to wealth but the rankings of high-income cities are falling: While cities in developed economies dominate the top half of the index (with the lower half dominated by cities in poorer countries), of the 14 cities in high-income countries, the rankings of ten have fallen since 2015.


Income is not the only factor governing city performance on security: Most of the cities in the top ten of the index are high-income or upper middle-income cities. However, two high-income cities in the Middle East (Jeddah and Riyadh) fall below position 40 in the index.
 

America’s failing infrastructure is reflected in its cities’ rankings: No US city makes it into the top ten in this category and only San Francisco appears in the top 20. The top ten cities in this category are either in Europe (Madrid, Barcelona, Stockholm, Amsterdam and Zurich) or Asia-Pacific (Singapore, Wellington, Hong Kong, Melbourne and Sydney).
 

However, the US performs well in digital security: Of the cities in the top ten in this category, four are North American (Chicago, San Francisco, New York and Dallas).


Friday, December 8, 2017

Freedom on the Net 2017


Governments around the world have dramatically increased their efforts to manipulate information on social media over the past year. The Chinese and Russian regimes pioneered the use of surreptitious methods to distort online discussions and suppress dissent more than a decade ago, but the practice has since gone global. Such state-led interventions present a major threat to the notion of the internet as a liberating technology.

Online content manipulation contributed to a seventh consecutive year of overall decline in internet freedom, along with a rise in disruptions to mobile internet service and increases in physical and technical attacks on human rights defenders and independent media.


Nearly half of the 65 countries assessed in Freedom on the Net 2017 experienced declines during the coverage period, while just 13 made gains, most of them minor. Less than one-quarter of users reside in countries where the internet is designated Free, meaning there are no major obstacles to access, onerous restrictions on content, or serious violations of user rights in the form of unchecked surveillance or unjust repercussions for legitimate speech.


Online manipulation and disinformation tactics played an important role in elections in at least 18 countries over the past year, including the United States.


Disinformation tactics contributed to a seventh consecutive year of overall decline in internet freedom, as did a rise in disruptions to mobile internet service and increases in physical and technical attacks on human rights defenders and independent media.


A record number of governments have restricted mobile internet service for political or security reasons, often in areas populated by ethnic or religious minorities.


For the third consecutive year, China was the world’s worst abuser of internet freedom, followed by Syria and Ethiopia. Source: Freedom House


Monday, December 4, 2017

Global Power City Index 2017


The annual Global Power City Index (GPCI) report evaluates and ranks 44 major cities according to their “magnetism,” or their overall power to attract creative individuals and enterprises from around the world. Cities are rated on the basis of six categories: Economy, R&D, Cultural Interaction, Livability, Environment, and Accessibility. 


Five major cities in the Asia-Pacific region—Tokyo, Singapore, Seoul, Hong Kong and Sydney—were ranked in the top 10 of the 2017 Global Power City Index (GPCI) report published today by The Mori Memorial Foundation’s Institute for Urban Strategies, a research institute established by Mori Building, a leading urban developer in Tokyo.

London, the No. 1 city in the comprehensive ranking for the sixth year in a row, further extends its lead over the competition by improving its scores for such indicators as GDP Growth Rate and Level of Political, Economic and Business Risk in Economy, and for Attractiveness of Dining Options and Number of Visitors from Abroad in Cultural Interaction.

New York (No. 2) increases its scores for the Economy indicators of Nominal GDP and GDP Growth Rate, but fails to make any significant headway in comprehensive score, having returned weaker scores this year in Cultural Interaction indicators such as Number of World-Class Cultural Events Held and Livability indicators like Variety of Retail Shops.
 

Tokyo claimed the No. 3 ranking for the first time last year and closes the gap on New York (No. 2) this year. This is a result of the American city’s score stalling while Tokyo continues to improve every year in the Cultural Interaction indicators of Number of Visitors from Abroad and Number of International Students. However, Japan’s capital city slips from No. 1 to No. 4 in Economy due to weaker scores in “Market Size” and “Market Attractiveness.”


Sunday, December 3, 2017

The ‘New Seven Wonders of the World’ 2017


These sites and monuments are popularly known as the “new Seven Wonders of the World,” modern additions to the ancient Seven Wonders laid out by Philo of Byzantium in 250 B.C., which included the hanging gardens of Babylon and the pyramids of Giza. (Of those ancient seven, only the pyramids remain.)  

The new wonders were chosen in 2007 through an online contest put on by a Swiss company, the New 7 Wonders Foundation, in which more than tens of millions of people voted. All are Unesco World Heritage sites. The following list of seven winners is presented without ranking, and aims to represent global heritage:

 The Great Wall of China:  Built from 220 B.C. to A.D. 1644 by several emperors and dynasties.


The Taj Mahal, India:  Built 1632-48. Commissioned by the Mughal emperor Shah Jahan.


 Petra. Jordan: Built 4th century B.C. to 2nd century A.D. by the Nabatean kingdom.


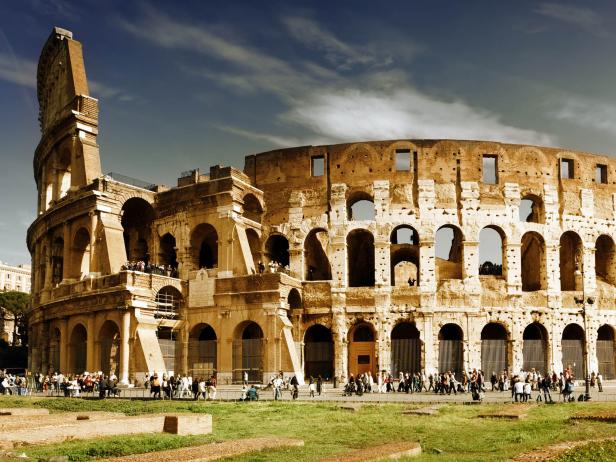
The Colosseum, Italy: Built A.D. 72-82. Commissioned by Flavian emperors during the first century of the Roman Empire.


Christ the Redeemer, Brazil: Built 1926-31. Commissioned by the Roman Catholic archdiocese of Rio de Janeiro.


 Chichén Itzá, Mexico: Built 5th-13th century by the Maya-Toltec civilization.


 Machu Picchu, Peru: Built in the mid-15th century by the Incas.

Saturday, December 2, 2017

Forest of the Future Library


The fate of physical books may seem tenuous, but at least 1,000 copies of 100 different books are set to be printed roughly a century from now, in the year 2114. Indeed, the trees that will be used to make the printing paper have already been planted.


These saplings were planted for the Future Library, a forward-looking art project that’s one part literary time capsule, one part environmental statement. The project, launched in 2014, plans to commission one book from a different author each year for 100 years, none of which will be published until 2114. 

 
The stories will be printed on paper made from the 1,000 trees planted in Nordmarka, a forest just north of Oslo. Until then, the manuscripts will be kept on the top floor of the Deichman Library in Oslo, in a space called the “Silent Room.” They will be on display but not made available to read for generations to come, meaning most of us won’t ever get the chance.


The Silent Room, set to open in 2019, will be made from the wood that was cleared from the Nordmarka forest to make room for the new trees. The room will only be big enough for a few visitors at a time, and will offer a view of the growing forest off in the distance.
Source: Atlas Obscura

Thursday, November 30, 2017

World Ranking of Car Exporters


Global car exports by country were valued at US$698.2 billion for 2016. Cars represent the world’s number one export product, surpassing crude petroleum revenues handicapped by lower oil prices.


Below are the 15 countries that exported the highest dollar value worth of cars in 2016:
  1. Germany: US$151.9 billion (21.8% of total car exports)
  2. Japan: $91.9 billion (13.2%)
  3. United States: $53.8 billion (7.7%)
  4. Canada: $48.8 billion (7%)
  5. United Kingdom: $41.3 billion (5.9%)
  6. South Korea: $37.5 billion (5.4%)
  7. Spain: $35.6 billion (5.1%)
  8. Mexico: $31.4 billion (4.5%)
  9. Belgium: $30.3 billion (4.3%)
  10. Czech Republic: $18.8 billion (2.7%)
  11. France: $18.4 billion (2.6%)
  12. Slovakia: $15.5 billion (2.2%)
  13. Italy: $15.2 billion (2.2%)
  14. Thailand: $11.6 billion (1.7%)
  15. Hungary: $11.1 billion (1.6%)
 Among the above countries, the fastest-growing car exporters since 2012 were Hungary (up 117%), Thailand (up 104.7%), Italy (up 64.5%) and Spain (up 41.6%). Four countries posted declines in their exported car sales: South Korea (down 11.6%), France (down -9.6%), Japan (down -5.7%) and the United States (down -1.4%). The listed 15 exporters accounted for 87.8% of global car exports by country during 2016. (World's Top Exports)
 
Light and dark blue countries represent small fractions of the overall market, no more than 2.7% of the total. The rose pink and salmon countries rise above the others, capturing 7-21.8% of the entire market. Source: how much